From a whole solar farm
to a single hot cell.
I designed and developed Solarview to turn aerial inspection data into something people can act on: find a problem, examine the imagery and produce a report.
My work connects the spatial data model, browser interface, server-side rules and image-processing integration.
What I built
A map gives findings their location. A table lets a reviewer compare classifications, severity and review status. Module reports bring optical and thermal imagery together with the assessment.
One important design choice: keep the original thermal observation separate from its interpretation, so a classification can change without losing the evidence.
Working with imagery or maps? Let’s talk ↗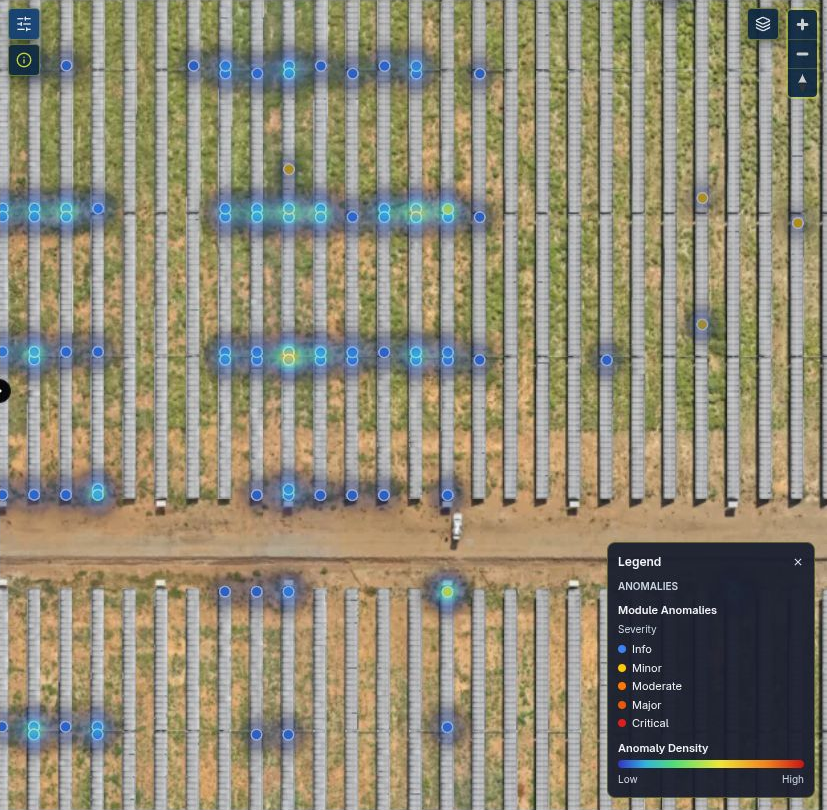
A live inspection close-up showing anomaly markers and their density across panel rows. The site boundary, plan drawing, client navigation and dates are excluded.
Actual application captures, cropped or permanently masked for confidentiality. These examples come from different inspections; the table and report are earlier captures.